
⚠️Not updated in over a year ⚠️Requests 1 sensitive permission
Description
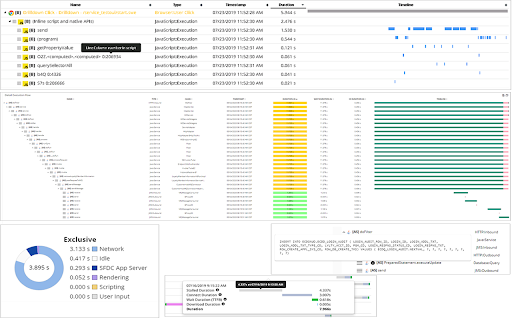
Features:
- Analyze JavaScript execution, in real-time, 24x7
- Correlate JavaScript calls with Application Back-end Code (e.g Java, C#, Python, Php, etc), Database SQL, Integration, etc
- All the above metrics can viewed on Germain UX dashboard (onPremise or cloud instance: https://germainux.com/cloud-login)
- Automate Task (Alert, Data Update, Service Restart, Reporting, etc)
- For all your users or a targeted user
Benefits:
- Identify whether a User Experience issue is caused by slow or failing JavaScript, browser, network, infrastructure, application, database, and deep dive within the code (JS or backend), in real-time, 24x7
Reviews (1 cached)
★☆☆☆☆2021-07-23
Utopia Tang
Not useable without account.
Permissions (2)
Permissions
debuggerℹ Can use Chrome's debugging protocol on other tabs storageℹ Can store data locally in your browser
Details
| Version | 2024.1.0 |
| Updated | Jul 2, 2024 |
| Size | 13.87KiB |
| First Seen | Mar 22, 2026 |
Popular in developer

Lighthouse
by lighthouse-extension-owners
1M
★ 4.42
developer
1M
★ 4.42
developer

Контур.Плагин
by kontur.extension
1M
★ 3.11
developer
1M
★ 3.11
developer

Similarweb - Website Traffic & SEO Checker
by Similarweb
1M
★ 4.66
developer
1M
★ 4.66
developer

Clear Cache
by Little Void LLC (Ben Bojko)
1M
★ 4.45
developer
1M
★ 4.45
developer

SEO META in 1 CLICK
by Bilal Hadri
900K
★ 4.87
developer
900K
★ 4.87
developer
Popular Extensions

Adobe Acrobat: PDF edit, convert, sign tools
by Adobe Inc.
330M
★ 4.40
workflow
330M
★ 4.40
workflow

Chrome Remote Desktop
by Chrome Remote Desktop Release Managers
38M
★ 3.14
workflow
38M
★ 3.14
workflow

Cisco Webex Extension
by cisco.chromestore
24M
★ 2.34
social
24M
★ 2.34
social

Kami for Google Chrome™
by Kami
17M
★ 4.56
education
17M
★ 4.56
education

Read&Write for Google Chrome™
by Texthelp
17M
★ 3.44
accessibility
17M
★ 3.44
accessibility