
✅Recently updated
Description
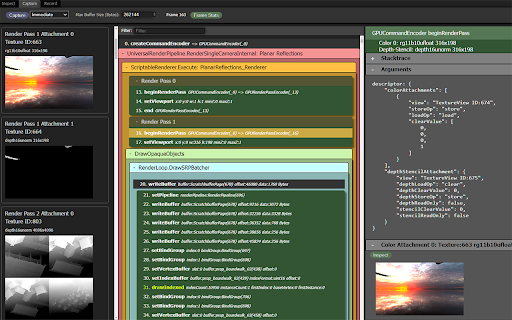
WebGPU Inspector is a Chrome Developer Tools extension for debugging WebGPU content. It intercepts all WebGPU objects and commands, allowing you to inspect information about any GPU object.
* Inspect any WebGPU object, with a stacktrace for where it was created.
* Capture frames, including all commands, buffers, textures, and render pass results.
* Catch errors compiling shader modules and pipelines.
* Display textures, at any mip level.
* Edit shaders live on the page to debug and test shader changes.
* Debug shaders (experimental, limited to compute shaders).
* Plot frame times and GPU object counts over time for profiling information.
* View uniform and storage buffer content used for draw and dispatch calls.
* Record all commands and data used to render a set of frames, generating a standalone HTML file that can recreate the render.


Reviews
Loading reviews...
Details
| Version | 1.0.1 |
| Updated | Mar 3, 2026 |
| Size | 306KiB |
| First Seen | Mar 22, 2026 |
Popular in developer

Lighthouse
by lighthouse-extension-owners
1M
★ 4.42
developer
1M
★ 4.42
developer

Контур.Плагин
by kontur.extension
1M
★ 3.11
developer
1M
★ 3.11
developer

Similarweb - Website Traffic & SEO Checker
by Similarweb
1M
★ 4.66
developer
1M
★ 4.66
developer

SEO META in 1 CLICK
by Bilal Hadri
900K
★ 4.87
developer
900K
★ 4.87
developer

影刀RPA
by sanco1987
900K
★ 3.46
developer
900K
★ 3.46
developer
Popular Extensions

Adobe Acrobat: PDF edit, convert, sign tools
by Adobe Inc.
330M
★ 4.40
workflow
330M
★ 4.40
workflow

Chrome Remote Desktop
by Chrome Remote Desktop Release Managers
38M
★ 3.14
workflow
38M
★ 3.14
workflow

Cisco Webex Extension
by cisco.chromestore
24M
★ 2.34
social
24M
★ 2.34
social

Kami for Google Chrome™
by Kami
17M
★ 4.56
education
17M
★ 4.56
education

Read&Write for Google Chrome™
by Texthelp
17M
★ 3.44
accessibility
17M
★ 3.44
accessibility